OVERVIEW
Data is no longer a byproduct of business workflow – it is THE critical asset that optimizes decision making and business processes across the entire organization in a repeatable manner. A Data Strategy Methodology is a plan designed to create a comprehensive overview of the ways an organization acquires, stores, manages, shares, and uses its data.
A well-defined data strategy consists of an architecture that supports a reporting framework that describes how data is collected, stored, transformed, distributed, and consumed.
Axis has deep experience in assisting customers with transforming their data into information yielding actionable insights. Across multiple industries, our teams have implementing expansive reporting solutions, from an initial assessment to production utilizing a proven data strategy methodology.
APPROACH AND METHODOLOGY
Our approach and methodology begin with an assessment that evaluates the current state, desired state and provides a roadmap with recommendations on the overall reporting architecture to enable specific insights.
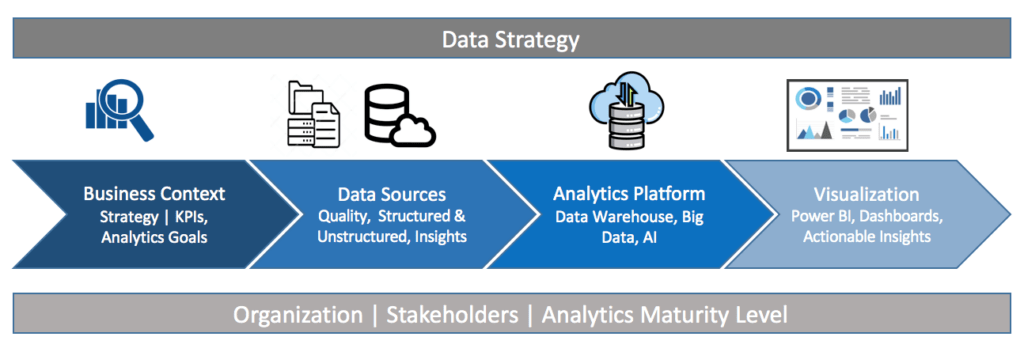
1. BUSINESS CONTEXT
The initial step is to understand an organization’s maturity level related to its analytics goal and help define KPI’s and reporting needs to enable data-driven decision making. As an example, if the scope of the data strategy is to obtain a 3600 view of customers and potential customers, the current state assessment would include any business process, data assets including architecture, capabilities (business & IT), and departmental policies that touch customers. The current state assessed is via interviews with employees involved in customer acquisition, retention, and processing.
The outcome will present multiple strategic options for initiatives and leads to the next task to prioritize these options with business objectives. Sponsors and stakeholders will have a key role in prioritizing.
2. DATA SOURCES
Identifying data and understanding its meaning regardless of structure, origin or location, is a critical step in establishing an organization’s analytical goals. Data can consist of structured sources such as databases, ERP | CRM, or HR applications and unstructured data such as e-mail messages, Word documents, videos, photos, audio files, presentations, webpages, and many other kinds of documents.
A Data inventory will be compiling these and enable the organization to better classify, organize and provide context to disparate data.
3. ANALYTICS PLATFORM
Once the data landscape has been outlined, analysis is conducted identifying gaps in data architecture, technology & tools, processes, and of course people (skills, training, etc.). Big Data brings new data sources into the mix and cloud computing enables new options for data integration and data storage. What results is a definitive approach to deploying a robust analytics platform utilizing best in class, big data tools, business intelligence software, data integration tools, and document management systems.
4. VISUALIZATION
Now the data is ready for sharing and distribution across the organization. Data visualization is the presentation of data in a pictorial or graphical format. Interactive visualization utilizes technology to drill down into charts and graphs. Based on the analytics goals, various options will be presented in the form of dashboards, actionable insights leveraging robust tools like Power BI, Tableau, etc.
DATA STRATEGY ROADMAP
A well-defined data strategy consists of an architecture that supports a reporting framework – data is collected, stored, and analyzed. The final output of the analysis is a Roadmap laying out the path from data to capturing information value.
BOTTOM LINE
The Axis Data Strategy Methodology allows clients to make business and reporting decisions faster and with more confidence, knowing how all the pieces fit together. We offer the experience, technology, and know-how to address some of the most complex data and AI reporting challenges.

